
Hopium's Economic Charts
Here's a current set of charts we refer to in day to day work.....

New Charts
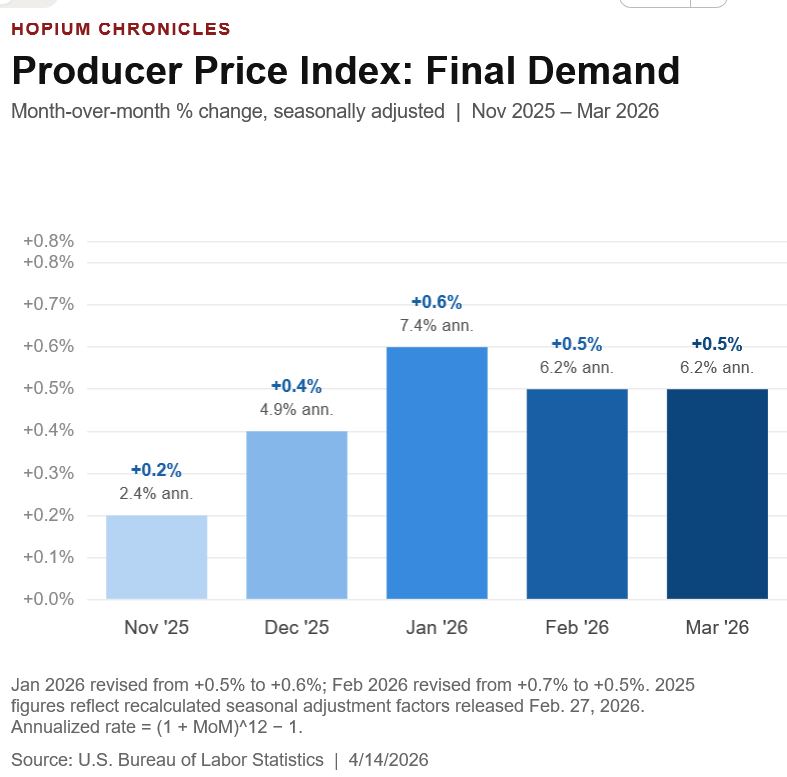
Morning all. This morning we got the third major inflation report, the Producer Price Index, and it increased by 0.5% in March, or 6.2% on an annualized basis.
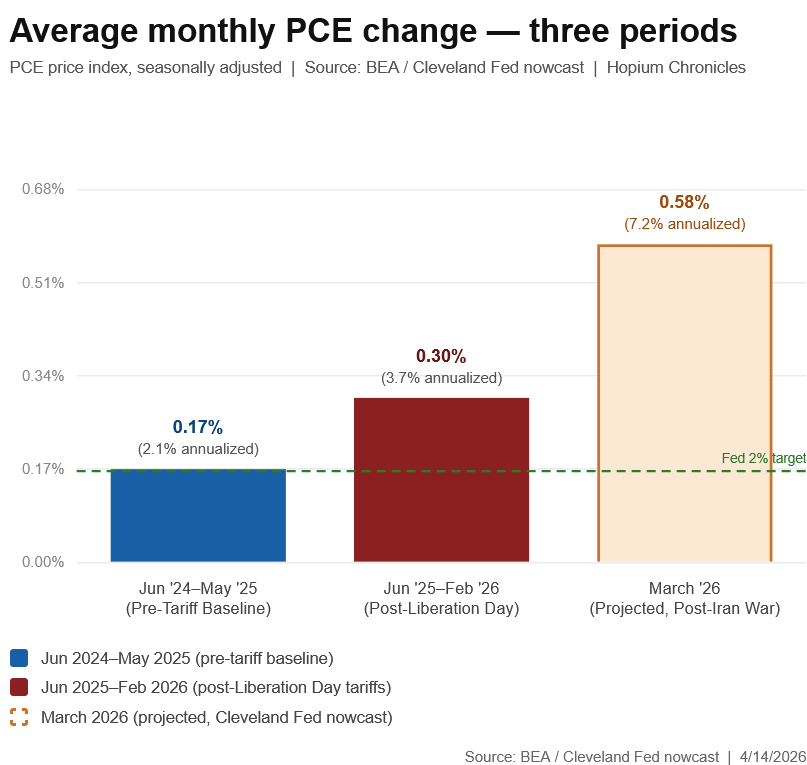
And here we can see the impact of the tariffs and the war on PCE headline reading (including volatile food and energy):
More Charts
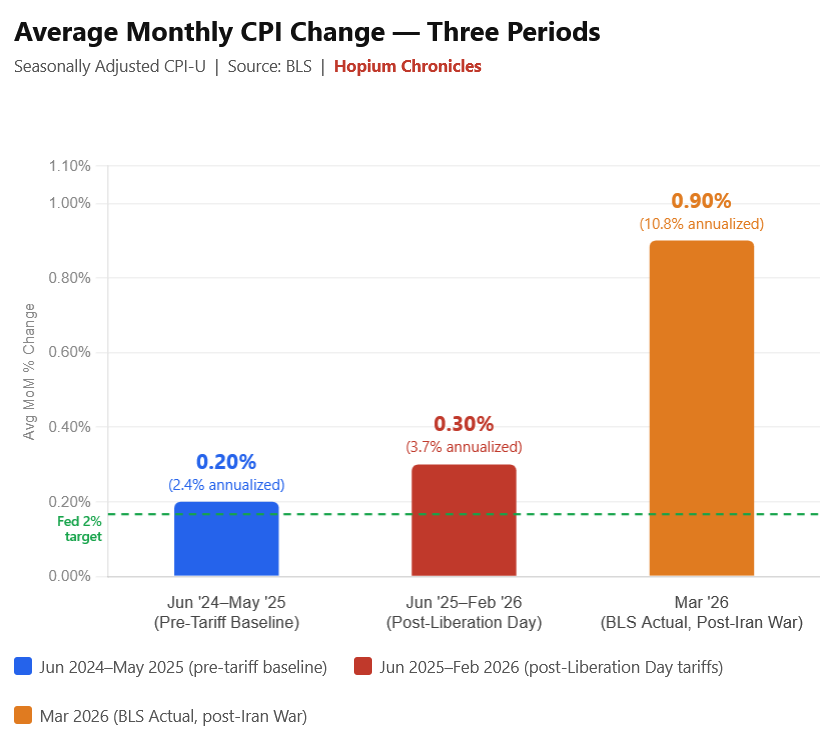
Last Friday’s Consumer Price Index report came in above expectations at a staggering increase of 0.9 percent in March:
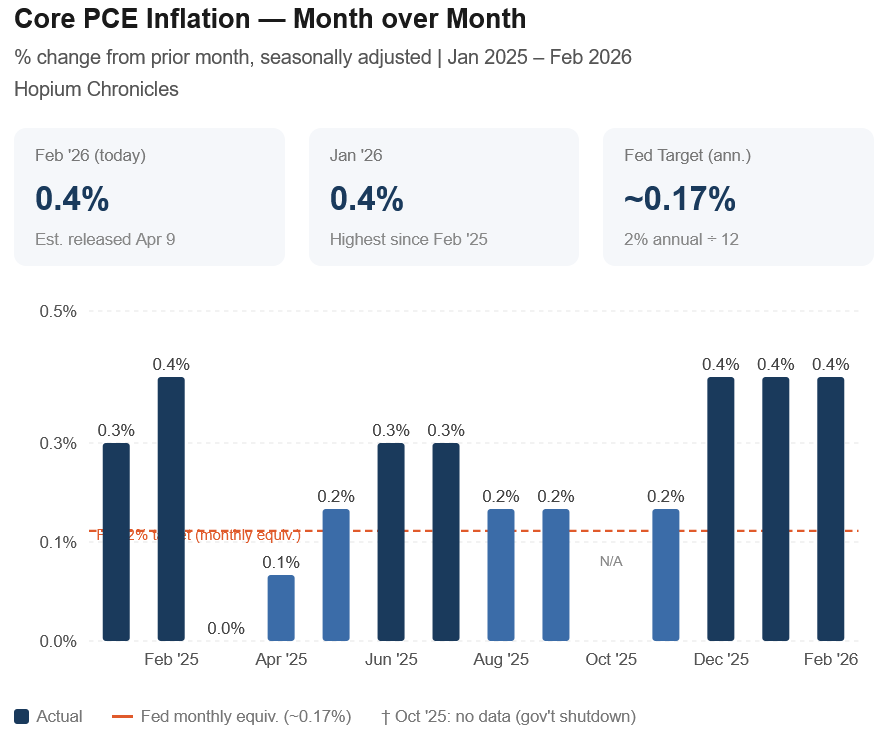
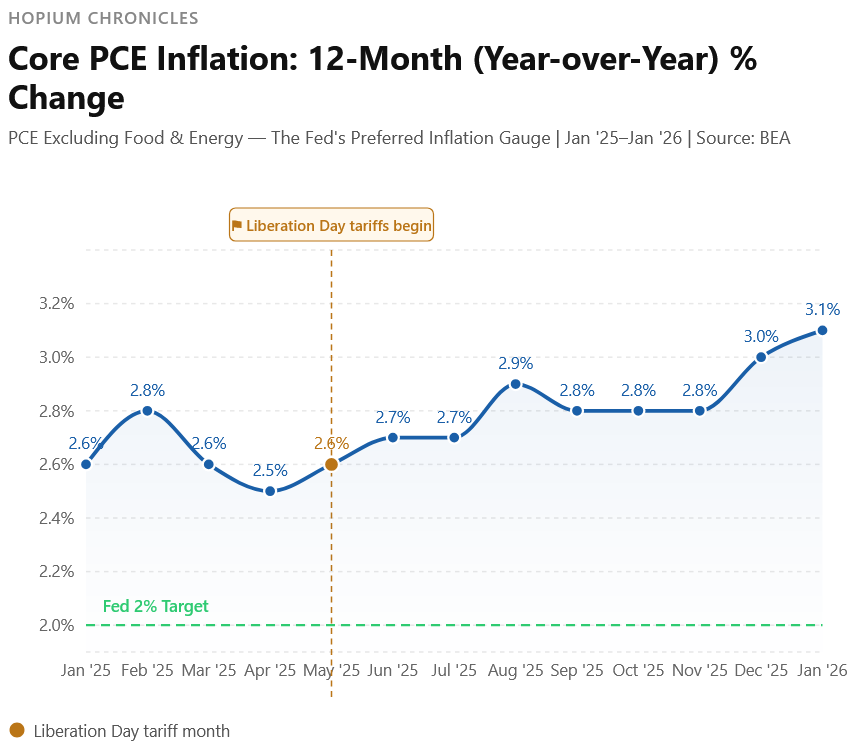
Last Thursday’s Personal Consumption Index (PCE), even though it had delayed data from pre-war February, still came in way too hot at 0.4 for both headline and core. Here are the trend lines for core PCE, inflation without food and energy, the Fed’s favorite inflation gauge:
That inflation was running so hot prior to the war, and job and GDP growth slowing, makes what Trump has done even more reckless, irresponsible, and irredeemable.
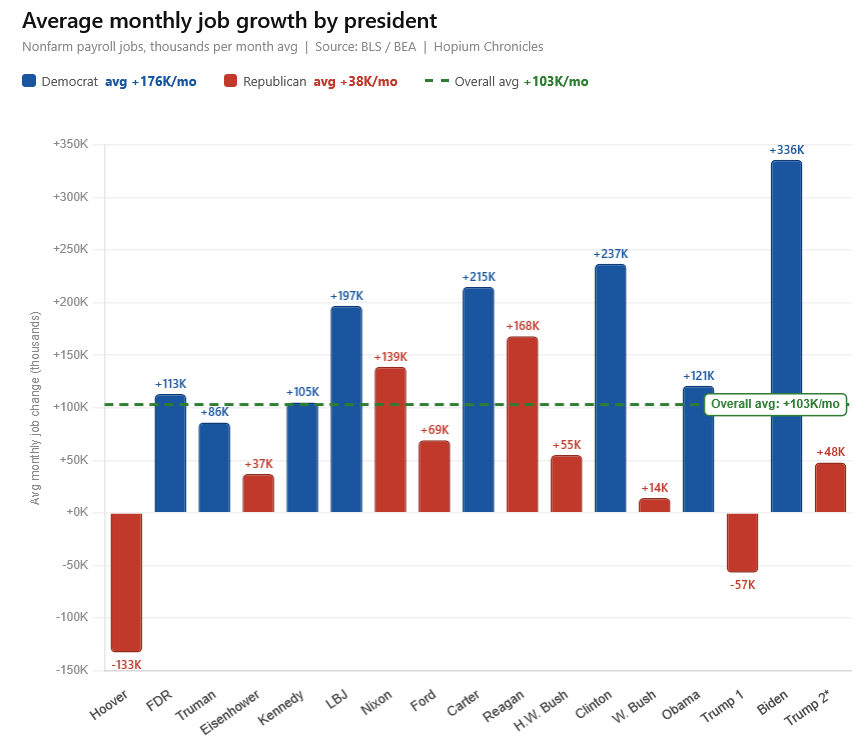
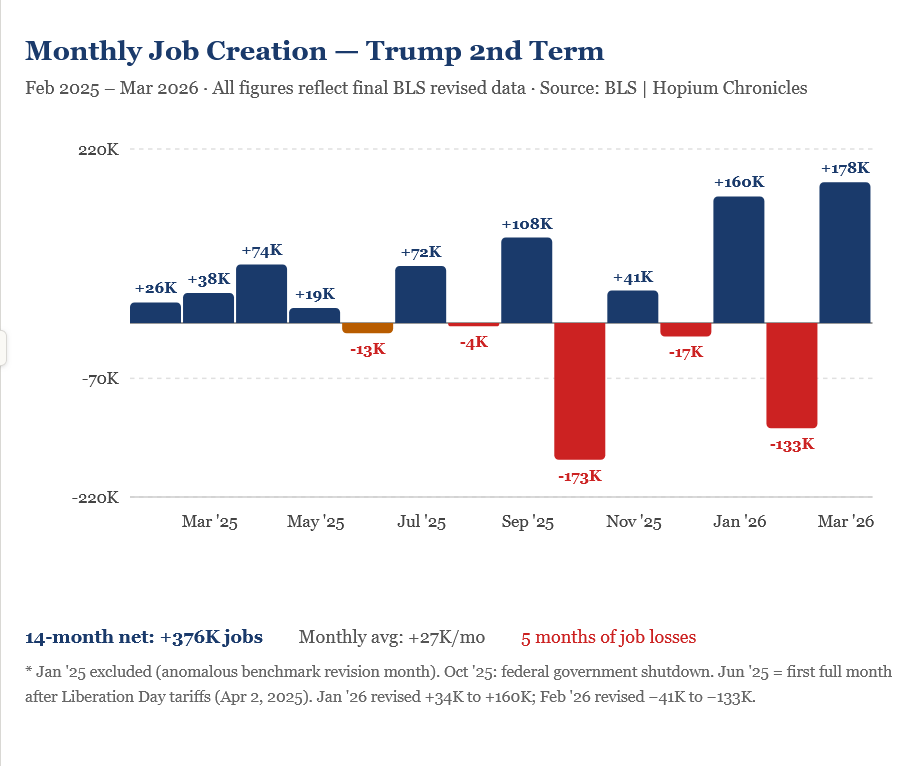
Here’s is the job growth we’ve seen so far under Trump compared to other Presidents. Like GDP growth it’s the worst net performance since Hoover:
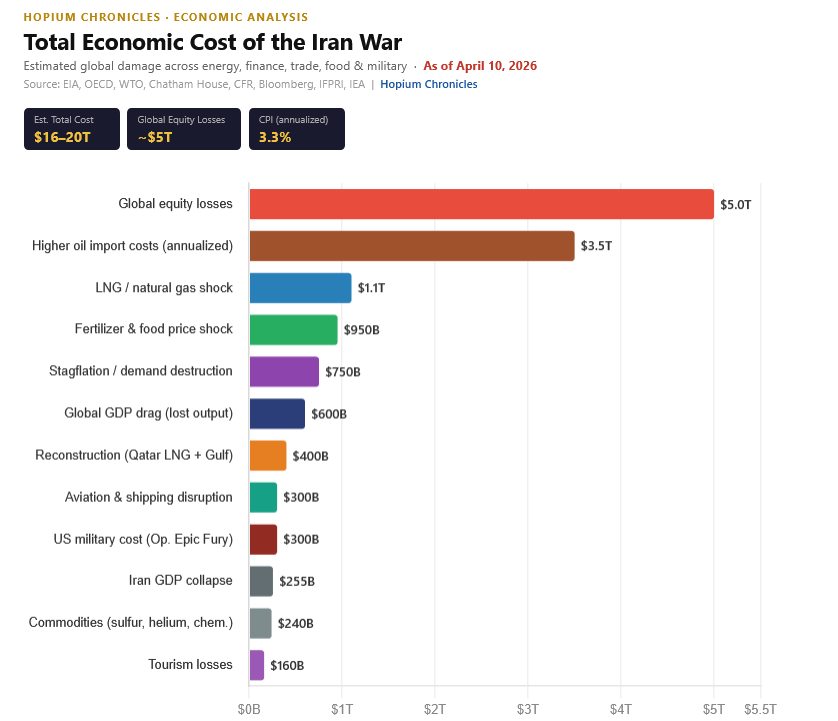
Here’s our revised estimate of the total cost of Trump’s failed war to the world. It already rivals the cost of the global economic crisis of 2008-2010 and COVID; is now double what it was a few weeks ago; and is now equal to China’s entire annual domestic output (GDP)
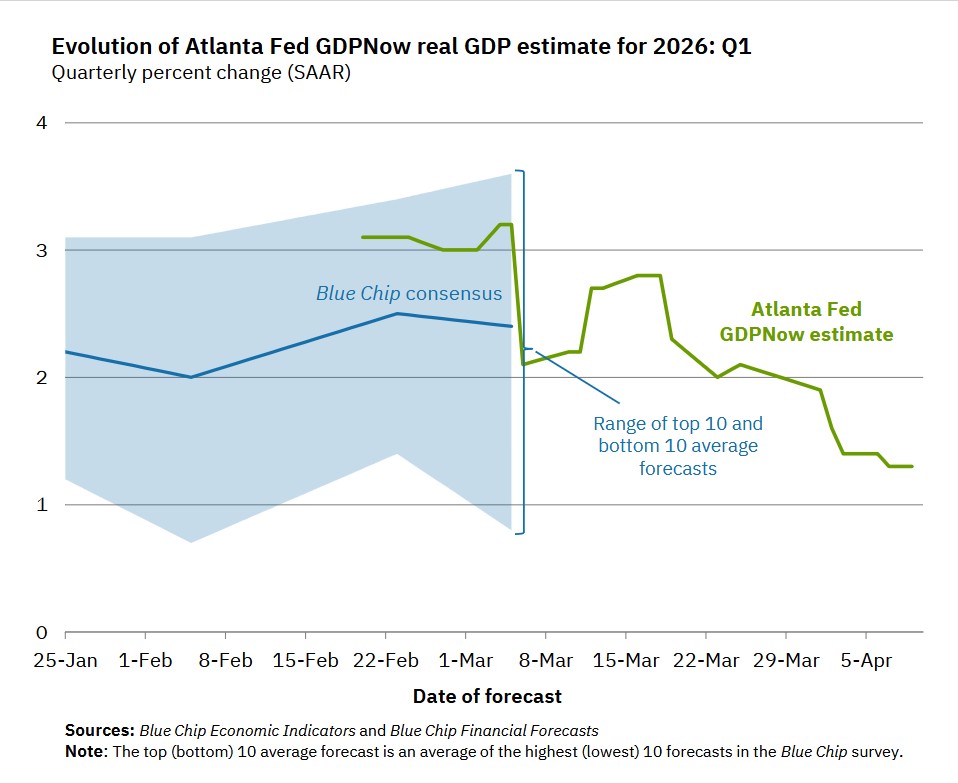
The Atlanta Fed’s GDPNow projections show q1 2026 GDP growth cratering since the war began from 3.2% to 1.3%:
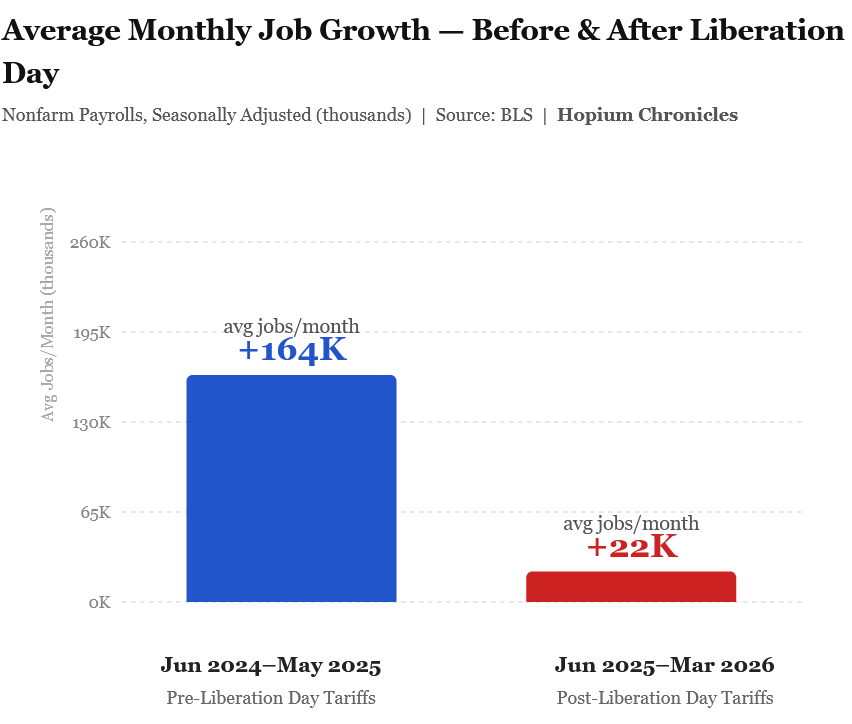
Here’s a comparison of average monthly job growth before and the tariffs:
Here’s job growth under Trump:
The OECD’s new projections has the American economy continuing to slow:
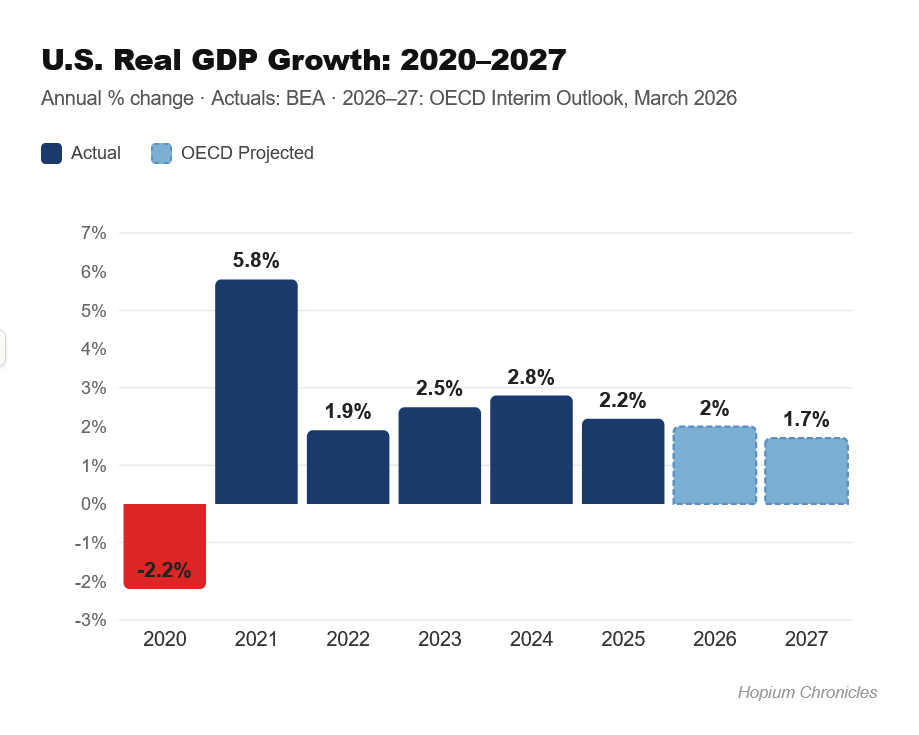
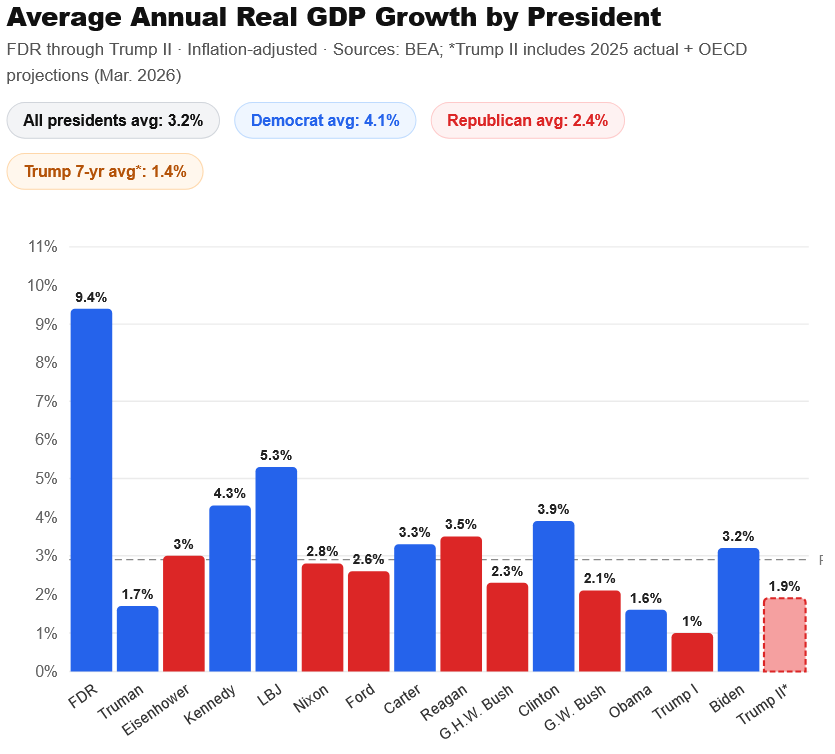
Trump is now on track to have the slowest GDP growth of any American leader in the last 80 years:
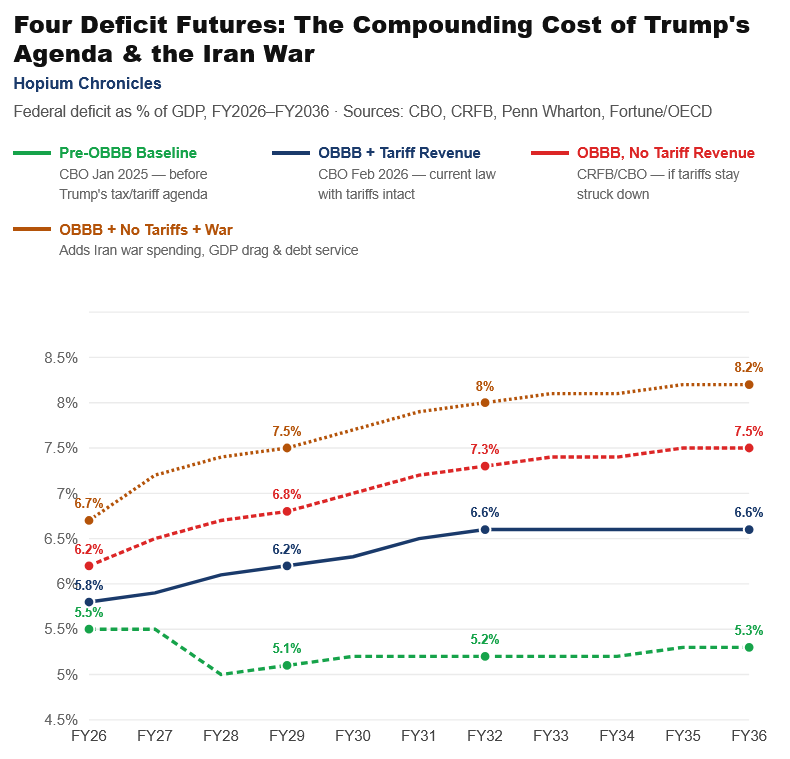
Trump’s policies - tax cuts, war, tariffs, mass deportation, higher inflation - are causing a significant and potentially dangerous erosion of our fiscal condition:
So none of that is any good. Where things are about to get very bad for Trump and the Rs is with inflation and rising interest and mortgage rates. Here is what we were seeing before the war and soaring energy, gas, and commodity prices. Inflation was way too high and rising:
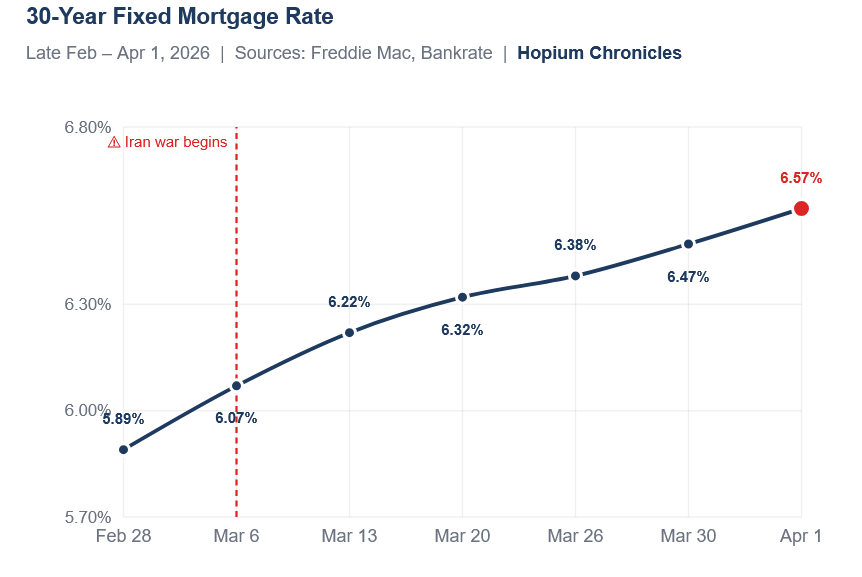
Mortgage rates have started taking off:
Simon, Thank you for all the great information on the charts, graphs, and all the other dismal outlook. We will all have to just assign ourselves to the fact that Fucking Trump is not going to do a damn thing! But, looking forward to the November elections, will give us a lot of Hopium!!! For now, we will have to tighten our belts!